
Investment Risk-Return Calculator Online – Calculate Risk & Returns
Estimate potential investment returns, understand risk levels, and compare risk-adjusted outcomes before making an investment decision.
Investment Risk-Return Calculator
Estimate the expected return and volatility of an investment portfolio, measure its Sharpe ratio, and understand whether the potential return appears reasonable relative to the assumed level of risk.
Portfolio assumptions
Enter allocation, expected return and volatility for each investment.
Risk-return summary
Enter your assumptions and calculate the portfolio.
Risk-return positioning
Each point represents an investment. Higher return and lower volatility are generally more attractive, but actual suitability depends on the investor and objective.
Risk-adjusted assessment
A simplified interpretation of the portfolio’s risk-return profile.
Investment-level breakdown
See how each investment contributes to the portfolio’s expected return and risk profile.
| Investment | Allocation | Expected return | Volatility | Amount | Return contribution |
|---|

What Is an Investment Risk-Return Calculator?
An Investment Risk-Return Calculator is an online financial analysis tool that helps you evaluate the relationship between the potential return of an investment and the level of risk assumed to achieve that return. Instead of looking at expected returns alone, the calculator considers factors such as expected return, investment risk or volatility, investment period, and risk-free rate to provide a more complete view of the investment outcome.
A higher expected return may come with greater uncertainty, while a lower-risk investment may offer more limited return potential. Understanding this relationship can help investors compare different investment assumptions and assess whether the expected return appears reasonable relative to the assumed level of risk.
What Does the Calculator Help You Measure?
Depending on the inputs provided, the calculator can help estimate:- Expected investment return based on your assumptions
- Portfolio risk or volatility representing the variability of potential returns
- Projected investment value over the selected investment period
- Risk-adjusted return after considering the assumed risk level
- Sharpe Ratio, which compares excess return with the level of risk assumed
For example, two investments may have the same expected return, but if one has substantially higher volatility, the risk-return profile of the two investments can be quite different.
Why Is Risk-Return Analysis Important?
Looking only at the expected return can give an incomplete picture of an investment. An investment expected to generate 15% annually may appear attractive, but its potential risk should also be considered. Risk-return analysis provides additional context by examining how much risk is being assumed for the expected return.
This can be particularly useful when comparing different portfolios, investment strategies, or hypothetical investment scenarios.
The calculator provides indicative estimates based on the assumptions entered by the user. Actual investment returns and risk can differ because financial markets are affected by market conditions, economic developments, asset prices, interest rates, and other factors. The results should therefore be used for analysis and educational purposes rather than as a guarantee of future investment performance.
How the Investment Risk-Return Calculator Works
Enter your investment assumptions and the calculator uses them to estimate potential returns and assess the relationship between expected return and investment risk.
Enter Investment Details
Enter the investment amount, expected annual return and investment period based on your chosen scenario.
Enter Risk Assumptions
Provide the expected volatility or risk level and the applicable risk-free rate.
Calculate Potential Outcomes
The calculator estimates the potential investment value and other risk-return measures from your inputs.
Review Risk-Adjusted Results
Review the calculated risk-return indicators, including the Sharpe Ratio, to understand the overall investment scenario.
Key Inputs Used in the Calculator
The calculator uses a few key assumptions to estimate potential investment outcomes and evaluate the relationship between expected return and risk. Enter values that reasonably reflect the scenario you want to analyse.
Initial Investment
The amount you plan to invest at the beginning of the investment period.
Expected Annual Return
The annual return assumption used to estimate the potential growth of the investment.
Investment Period
The expected duration for which the investment remains invested.
Investment Risk / Volatility
The assumed variability of investment returns used to represent the level of risk.
Risk-Free Rate
The assumed return from a relatively low-risk benchmark used in risk-adjusted analysis.
Other Calculator Assumptions
Additional values shown in the calculator may influence the resulting risk-return analysis.
Understanding Your Risk-Return Results
Once you enter the required assumptions, the calculator presents several indicators that help you understand the expected return, investment risk and risk-adjusted performance of the scenario.
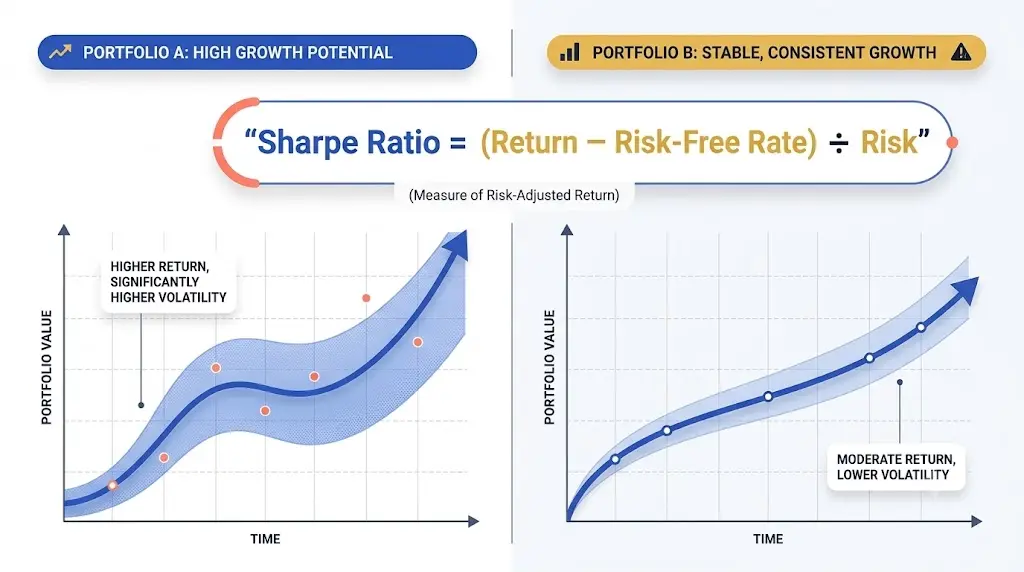
The visual representation is illustrative. Your actual calculated results depend on the assumptions entered into the calculator.
Expected Return
Shows the annual return assumption used for estimating the potential growth of the investment.
Investment Risk
Represents the assumed variability of returns. Higher volatility indicates greater variation in potential outcomes.
Projected Investment Value
Indicates the estimated future value based on the investment amount, expected return and selected period.
Risk-Adjusted Performance
Provides additional context by considering the return relative to the assumed level of investment risk.
What Is the Sharpe Ratio?
The Sharpe Ratio is a widely used measure of risk-adjusted return. It compares the return earned above the risk-free rate with the level of investment risk assumed to generate that return.
Expected Return
The annual return assumption used for the investment or portfolio being analysed.
Risk-Free Rate
The benchmark return used to determine the investment’s excess return over the risk-free rate.
Investment Risk
The assumed volatility or variability of investment returns used in the calculation.
How to Interpret Investment Risk and Return
Risk and return should be considered together. A higher expected return may involve greater variability, while a lower-risk scenario may have more limited return expectations.
Higher Expected Return
A higher return assumption may be accompanied by greater volatility. This means the actual outcome can vary more significantly from the expected return.
Lower Assumed Risk
A lower-risk scenario may show less variability in potential returns. However, the expected return may also be lower depending on the investment assumptions.
Investment Risk-Return Example
Consider an investor who wants to analyse a hypothetical ₹5,00,000 investment using an expected annual return of 12%, assumed investment risk of 15%, and a risk-free rate of 6%.
Annual return assumption used for the example.
Benchmark return used for risk-adjusted analysis.
Expected return above the assumed risk-free rate.
Based on the simplified assumptions used in this example.
Risk-Return Calculator vs. Simple Return Calculator
A simple return calculation focuses primarily on investment growth, while risk-return analysis adds information about the level of risk associated with the expected return.
Key difference: A simple return calculation answers how much an investment may grow based on a return assumption. Risk-return analysis adds another dimension by considering the risk associated with that expected return.
Know the Limitations Before Using the Results
Risk-return analysis depends on the assumptions entered into the calculator. The results should be interpreted as estimates rather than predictions of actual investment performance.
Investment risk and return calculations can provide useful analytical context, but they cannot capture every factor that can influence an investment. Keep the following points in mind when interpreting the results.
Expected Returns Are Assumptions
The expected return entered into the calculator is an assumption. Actual returns may be higher or lower depending on future market conditions.
Risk Estimates Can Change
Investment volatility is not constant. Historical or assumed risk may not accurately represent future market behaviour.
Markets Are Not Fully Predictable
Economic events, interest rates, company results, market sentiment and other factors can affect investment outcomes.
Sharpe Ratio Has Contextual Limitations
The Sharpe Ratio depends on the return, risk and risk-free-rate assumptions used. It should be considered alongside other relevant analysis.
Results Are Not Investment Advice
The calculator provides educational and indicative estimates. It does not determine whether an investment is suitable for a particular investor.
Frequently Asked Questions
Get quick answers about the Investment Risk-Return Calculator, Sharpe Ratio, risk, expected returns, and how to interpret the results.
An Investment Risk-Return Calculator is an online tool that helps estimate potential investment returns while considering the level of risk or volatility associated with those returns. It can also calculate risk-adjusted measures such as the Sharpe Ratio.
The calculator uses inputs such as initial investment, expected annual return, investment period, investment risk or volatility, and risk-free rate to estimate potential outcomes and evaluate risk-adjusted performance.
Common inputs include the initial investment amount, expected annual return, investment period, investment risk or volatility, and risk-free rate. The exact inputs may vary depending on the calculations supported by the tool.
Investment risk generally represents the variability or volatility associated with investment returns. A higher risk assumption means the expected return is subject to greater uncertainty.
The Sharpe Ratio is a risk-adjusted performance measure. It compares the excess return of an investment over the risk-free rate with the investment’s level of risk. A commonly used formula is: (Expected Return − Risk-Free Rate) ÷ Investment Risk.
A higher Sharpe Ratio generally indicates more excess return relative to the amount of risk assumed, based on the inputs used. It should be interpreted in context and does not by itself determine whether an investment is suitable.
No. The calculator does not predict or guarantee future returns. It provides indicative estimates based on the assumptions entered by the user. Actual investment performance can differ because market conditions and other factors change over time.
Looking only at expected return may not provide a complete picture. Two investments can have similar expected returns but substantially different levels of risk. Risk-return analysis adds another dimension for evaluating potential outcomes.
A simple return calculator generally focuses on investment growth or returns. A risk-return calculator additionally considers factors such as investment risk, risk-free rate, and risk-adjusted performance measures such as the Sharpe Ratio.
Not necessarily. A higher expected return may involve higher investment risk. Risk, investment horizon, objectives, and other factors should be considered when evaluating an investment.
Yes. You can use consistent assumptions for different investments or scenarios and compare their expected returns, risk levels, and risk-adjusted results. The comparison should be interpreted in the context of each investment’s characteristics.
No. The results are indicative estimates based on the information and assumptions entered into the calculator. Actual returns, investment values, and risk levels may differ from the calculated results.
The calculator is intended for informational and educational purposes. It can help with financial analysis, but it should not be treated as personalized investment advice or as the sole basis for making an investment decision.

Explore More Investment Calculators
Effective investment planning involves more than choosing a monthly SIP amount. Explore our free investment calculators to project SIP growth, evaluate Step-Up SIP contributions, estimate potential returns, and plan for long-term financial goals.
These tools help you understand how changes in your investment amount, expected return, investment tenure, and contribution frequency may affect your projected results. Whether you are starting a new SIP, increasing your contributions over time, or working towards a specific financial milestone, these calculators can help you compare different investment scenarios and make more informed financial planning decisions.
Related Finance & Investment calculator
- Free Lumpsum Investment Calculator: Maximize The Future Value
- Mutual Fund CAGR Calculator – Calculate Investment Returns
- Free SIP Calculator Online – Calculate Monthly SIP Returns
- SIP Goal Calculator – Monthly SIP Required To Reach Your Goal
- STP Calculator – Plan Mutual Fund Transfers & Estimate Returns
- SWP Calculator – Plan Monthly Withdrawals & Retirement Income
- XIRR Calculator – Find Your True Annual Investment Return (%)
- Step-Up SIP Calculator Online – Calculate SIP Growth & Returns
- Mutual Fund Calculator Online – Calculate Returns & Growth
- SIP Vs Lumpsum Calculator – Compare Investment Returns
- Investment Goal Calculator Online – Plan Your Future Corpus
- Free Retirement Calculator: Calculate Your Retirement Corpus
- Free Inflation Calculator: Estimate Future Cost Of Living
- Home Loan Eligibility Calculator – Check Maximum Loan Eligibility
- Personal Loan Eligibility Calculator – Check Loan Eligibility
- Home Loan Affordability Calculator – Estimate Home Buying Budget
- Debt-to-Income Ratio Calculator – Check Loan Eligibility
- Rent Vs Buy Calculator Online – Compare EMI, Rent & Investment
- Fixed Vs Floating Interest Rate Calculator – Compare EMI & Interest
- Flat Rate Vs Reducing Rate Calculator – Find Real Interest Rate
- Step-Up EMI Calculator – Calculate Increasing EMI Online
- Loan APR Calculator – Calculate Annual Percentage Rate
- Loan Refinancing Calculator – Calculate EMI & Interest Savings

Stay Ahead With Smarter Financial Planning
Disclaimer
The Investment Risk-Return Calculator is provided for informational and educational purposes only. The results are indicative estimates based on the investment amount, expected annual return, investment tenure, assumed investment risk or volatility, risk-free rate, and other information entered by the user. Actual investment value, returns, risk levels, risk-adjusted performance, and investment outcomes may vary depending on market conditions, investment timing, changes in NAV, fund performance, volatility, expenses, taxation, and other factors.
The calculator does not guarantee any returns or predict future investment performance and should not be considered investment, financial, or tax advice. The assumed rate of return, risk or volatility, risk-free rate, and other inputs are used only for illustration and may not reflect the actual performance of any mutual fund, security, investment product, or future market conditions. Users should consider their investment objectives, time horizon, liquidity requirements, financial circumstances, and risk tolerance before making investment decisions.